How to Read a Topographic Map

By: Debra Ronca
Topographic map detail
Topographic maps allow you to see a 3-D landscape on a 2-D surface. © HowStuffWorks

We're­ all familiar with maps. They're those pieces of pa­per we pull out of the glove compartment — those crispy documents that unfold so large our view of the road i­s completely obstructed. They make us wish we had go-go-gadget arms that stretched to their widths and two sets of eyes — one focused on the road and one on the plotted path. They make us wish the voice of that woman on the GPS system hadn't led us down a dead-end street.

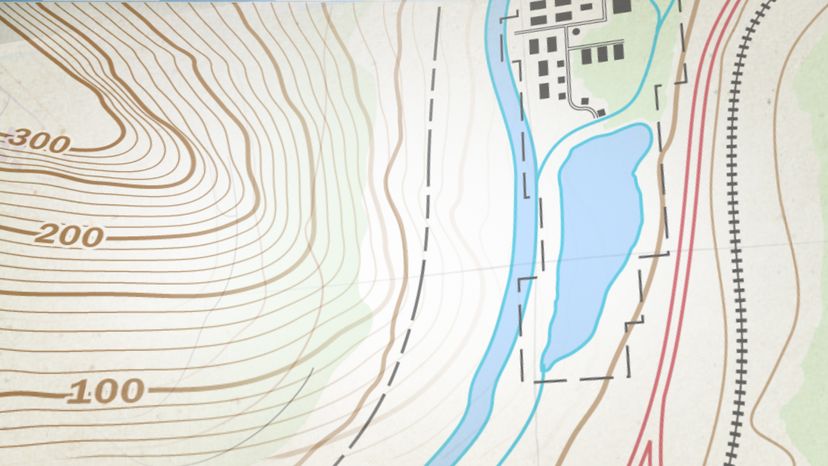
Different maps serve different purposes. If you're trying to drive from Point A to Point B and prefer a map over GPS instructions, a regular road map is the way to go. But if you've strayed from the road, perhaps on a backpacking trek, you need to see the terrain and the contours of the land. And that means you need to be able to read a topographic map.

Advertisement

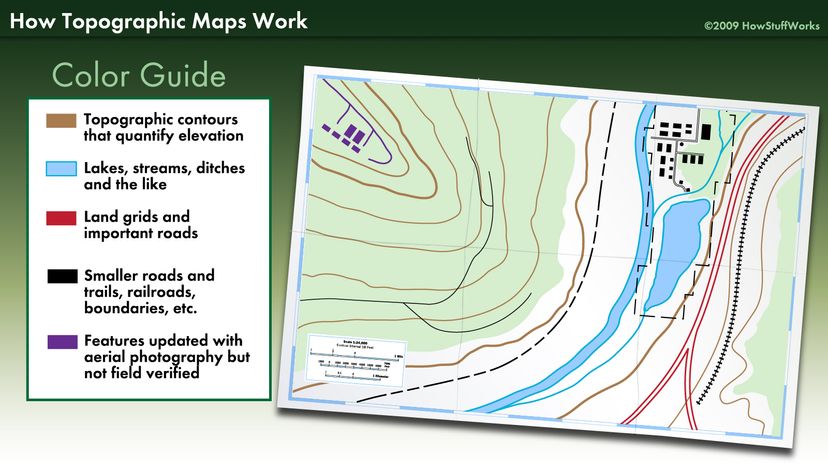
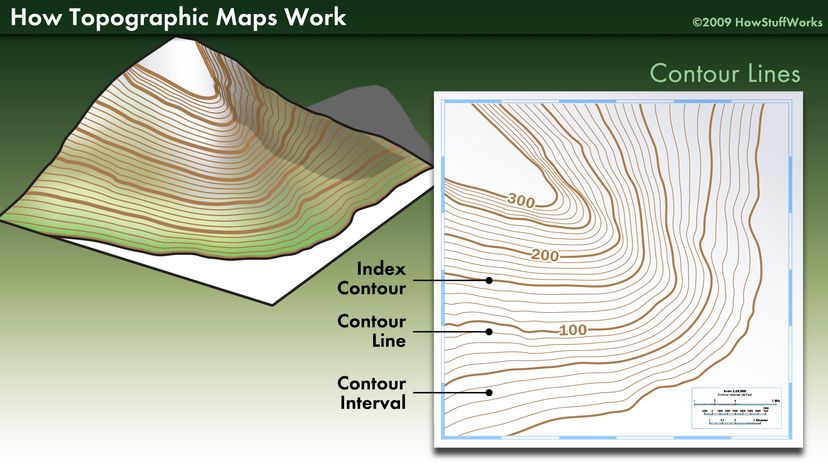
What's the difference between a topographic map and a regular map? In a nutshell, topographic maps allow you to see a three-dimensional landscape on a two-dimensional surface. These maps show the land's contours, elevations, mountains, valleys, bodies of water, vegetation and more. This contour and elevation inf­ormation distinguishes them from other maps.

­The U.S. Geological Survey (USGS) produced its first topographic map in 1879, and it still produces them today. Developments in aerial photography and satellite imaging make these maps much more accurate and efficient to produce than in the days when they were created by hand. When the USGS first started creating maps — which it did to catalog public land — the process was time-consuming and costly. Mule pack train was the only way to reach the mostly unsettled West, and cartographer's tools were crude compared with today's. Mapmakers would find an area's best vantage point — usually the highest point — and climb up to it with drawing boards and sighting devices. Then they would plot their maps, with the features that they could see and measure. This required both skill and daring. The advent of airplanes in the 1940s helped to advance mapping techniques.

Advertisement

Topographic Map Lines, Colors and Symbols

Topographic map guide
A guide to the colors typically used on a topographic map © HowStuffWorks

Unlike a regular map, where you mostly see highways and roads, a topographic map provides a more realistic view of th­e landscape. Features on a topographic map include:

  • Culture: roads, buildings, urban development, boundaries, railways, power transmission lines
  • Water: lakes, rivers, streams, swamps, rapids
  • Relief: mountains, valleys, slopes, depressions
  • Vegetation: wooded and cleared areas, vineyards and orchards
  • Toponymy: place names, water feature names, highway names

[source: Natural Resources Canada]

Advertisement

Because the maps show so much information, they have a wide variety of uses. People use topographic maps for engineering, conservation, environmental management, public works design, urban planning and outdoor activities like fishing, hiking or camping.

The first step in learning how to read a topographic map is to understand how to interpret the lines, colors and symbols. On these maps, you'll see large expanses of green for vegetation, blue for water and gray or red for densely built up areas. Houses are small black squares. You'll see big buildings — your local shopping center, for example — as their actual shapes.

Lines on a topographic map can be straight or curved, solid or dashed, or a combination. These lines indicate boundaries, contours, roads, streams and more. You'll see these lines in many colors — brown, blue, red, black and purple. Each color means something different.

A topographic map uses symbols to keep the map less crowded, but it's still chock-full of information. The U.S. Geological Survey (USGS) lists the following symbols on its topographic maps:

  • Boundaries
  • Buildings and related features
  • Coastal features
  • Contours
  • Control data and monuments
  • Glaciers and permanent snowfields
  • Land surveys
  • Marine shorelines
  • Mines and caves
  • Projection and grids
  • Railroads and related features
  • Rivers, lakes and canals
  • Roads and related features
  • Submerged areas and bogs
  • Surface features
  • Transmission lines and pipelines
  • Vegetation

Advertisement

Topographic Map Contour Lines

Topographic map contour lines
Contour lines help users to see points of equal elevation. © HowStuffWorks

Co­ntour li­nes are the greatest distinguishing feature of a topographic map. Contour lines are lines drawn on a map connecting points of equal elevation, meaning if you physically followed a contour line, elevation would remain constant. Contour lines show elevation and the shape of the terrain. They're useful because they illustrate the shape of the land surface — its topography — on the map. Here's a cool way to understand how to interpret contour lines: Take an object like a ball or a pile of laundry, and shine a red laser pointer along the object's side. The line you see will look like a contour line on a topographic map.

In order to keep things simple, topographic maps show lines for certain elevations only. These lines are evenly spaced apart. We call this spacing the contour interval. For example, if your map uses a 10-foot contour interval, you will see contour lines for every 10 feet (3 meters) of elevation — lines at 0, 10, 20, 30, 40 and so on. Different maps use different intervals, depending on the topography. If, for example, the general terrain is quite elevated, the map might run at 80- to even 100-foot (24- to 30-meter) intervals. This makes it easier to read the map — too many contour lines would be difficult to work with. Look in the margin of your map to find out its contour interval.

Advertisement

To make topographic maps easier to read, every fifth contour line is an index contour. Because it's impractical to mark the elevation of every contour line on the map, the index contour lines are the only ones labeled. The index contours are a darker or wider brown line in comparison to the regular contour lines. You'll see the elevations marked on the index contour lines only. To determine elevations, pay attention to the amount of space in between lines. If the contours are close together, you're looking at a steep slope. If the contours have wide spaces in between — or aren't there at all — the terrain is relatively flat.

Topographic Map Scale

Topographic map legend
A scale helps users to understand how the map measures up to the real world. For U.S. Geological Survey topographic maps, 1:24,000 is the scale most often used. © HowStuffWorks

Another thing you need to understand about a topographic map is scale. Obviously, maps aren't life-sized. Otherwise we'd never be able to fit them in our backpacks. Instead, cartographers plot maps on a ratio scale, where one measurement on the map equals another larger amount in the real world.

The first number of the scale is always one. It's your unit of measurement, usually an inch. The second number is the ground distance. For example, if your U.S. Geological Survey (USGS) map has a scale of 1:24,000, it means that 1 inch on the map is equal to 24,000 inches (2,000 feet or 610 meters) in the real world. Your map's scale legend will always be at the bottom.

Advertisement

For USGS topographic maps, 1:24,000 is the scale most often used. Maps based on metric units use a scale of 1:25,000, where one centimeter equals 0.25 kilometers. You'll find most of the United States mapped at the 1:24,000 scale, with only a few exceptions. Puerto Rico, for example, maps at 1:20,000 or 1:30,000 because the country originally mapped at a metric scale. A couple of states map at 1:25,000, and most of Alaska (due to its size) maps at 1:63,360. The more populated areas of Alaska, though, map at the typical 1:24,000 or 1:25,000.

A 1:24,000 map is large and provides a lot of detail about the area — it will include buildings, campgrounds, ski lifts, among other things. You may also see footbridges and private roads on a map of this scale.

It requires about 57,000 maps at this scale to cover the 48 contiguous United States, Hawaii and territories [source: sewers, power and water lines, and streets. The common scale for these maps is 1:600. If you want to see one large area on a single sheet but with less detail, a smaller scale map like 1:250,000 is better.

Advertisement

Hiking With a Topographic Map

Topographic maps are a valuable tool for hikers and campers. You can plan an entire trip with the help of a topographic map, and you'll greatly decrease your chances of any unpleasant surprises. Your map can tell you a lot — details about an area's elevation, the best way to ascend a peak or how to orient yourself using landmarks.

It's always best (and safer) to plan your hike in advance. Once you've selected the area in which you and your friends will be walking, get yourself a topographic map. There are lots available for recreation purposes — the U.S. Geological Survey (USGS), for example, offers them online.

Advertisement

Trails appear on a topographic map as thin black lines. Roads will be thicker red or black lines. As you choose your route from Point A to Point B, keep a close eye on your map's contour lines. If the lines are far apart, any changes in elevation will be gradual. If they're close together, though, you'll have a steep hike ahead of you. You'll see the highest point or peak of your climb as a circle in the center of the lines — sort of like the rings on a tree.

­If a climb looks too steep for your adventure level, you can use the map to plan an easier route around any hills or mountains. As we stated earlier, if you follow the contour lines from the map, your elevation will remain relatively stable.

Once you've chosen the best route, take a look at the scale to find out the exact distance you'll be hiking. This way you'll know the amount of supplies you'll need in your backpack. Keep in mind you likely won't be hiking in a straight line, though. Experts advise using a string to mark your route on the map — including all the twists and turns — and then translating your string distance to the map's scale.

Your map will also show you where to locate water as well as how to stay within the timberline in case you end up needing shelter. Don't forget to note the symbols on the map to ensure you're not hiking into any private property or dangerous areas such as mine shafts or caves.

Advertisement

Lots More Information

Re­lated HowStuffWorks Articles

More Great Links

  • Bowie, Soren. "Preparing for a Hike Using a Topographic Map." Trails.com. 2008. (Feb. 18, 2009) http://www.trails.com/articles/preparing-for-a-hike-using-a-topographic-map.aspx
  • National Resources Canada. "Topographic Maps - Tips and Hints." Sept. 28, 2018. (April 8, 2020) https://www.nrcan.gc.ca/earth-sciences/geography/topographic-information/maps/national-topographic-system-maps/topographic-maps-tips-and-hints/9809
  • Reed, Mary. "How to Read a Topo Map." Get Out! 2009. (April 8, 2020) http://www.getoutzine.com/node/593
  • Riesterer, Jim. "Map Scales." Geospatial Training & Analysis Cooperative. April 7, 2008. (April 8, 2020) http://geology.isu.edu/wapi/geostac/Field_Exercise/topomaps/map_scale.htm
  • U.S. Geological Survey. "Map Scales." Aug. 3, 2006. (April 8, 2020) https://prd-wret.s3.us-west-2.amazonaws.com/assets/palladium/production/atoms/files/Map%20Scales.pdf
  • U.S. Geological Survey."Topographic Map Symbols." April 28, 2005. (April 8, 2020) https://prd-wret.s3.us-west-2.amazonaws.com/assets/palladium/production/atoms/files/Topographic%20Map%20Symbols.pdf
  • U.S. Geological Survey. "Topographic Mapping." Feb. 25, 2008. (Feb. 13, 2009) http://egsc.usgs.gov/isb/pubs/booklets/topo/topo.html
  • U.S. Geological Survey. "USGS Maps Online Edition." April 13, 2005. (Feb. 13, 2009) http://egsc.usgs.gov/isb/pubs/booklets/usgsmaps/usgsmaps.html

Advertisement

Loading...